As a former Peace Corps volunteer in Muyinga province in 1993, I had occasion to witness some of the violence in Burundi first hand
Shannon England
This paper is an attempt to explore the relationship between violent conflict and environmental scarcity by focusing on Burundi as a case study. As a former Peace Corps volunteer in Muyinga province in 1993, I had occasion to witness some of the violence in Burundi first hand. This paper provided me an opportunity to explore the conflict from political, demographic, and environmental viewpoints. In the course of study, I determined that there is some evidence to indicate that access to agricultural land played a crucial role in the conflict that continues to engulf Burundi today. While the association does not prove causality, it may point the way to important policy recommendations for solving the problems facing Burundi. These include fostering a greater role of engagement from the international community, improvements in the Burundian judicial system, an expansion of family planning programs in Burundi, and focused research into improving the agricultural yields in the area.
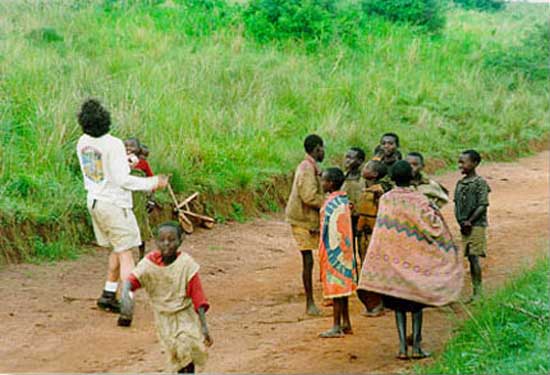
Links are provided below to charts and maps about Burundi. A few photos from Burundi are followed by the complete paper.
Map of Africa, Population Density by Country, Large
Map of Africa, Population Density by Country, Small
General Map of Burundi
Map of Burundi's Agricultural Regions
Map, Burundi's Population Density, 1988
Map, Burundi's Coffee Production, 1988
Map, Burundi's Population Density, 1991
Map, Population Density for 1991 and Election Results for Burundi, 1993
Map, Population Density for 1991 and Violent Conflict for 1993
Map, Regions of Violent Conflict in Burundi, 1965 and 1972
Chart One: Population Growth in Burundi 1950 - 1996
Chart Two: Comparative Statistics on Population Density
Chart Three: Population Density for Rwanda and Burundi
Chart Four: Percentage of People Living in Absolute Poverty in Africa
Chart Five: Average Life Expectancy Around the World
Chart Six: Burundian Children Suffering From Wasting and Stunting
Chart Seven: Daily Per Capita Calorie Supply, Percentage of Requirements Being Met for Aftica
Chart Eight: Effects of Ethnic Violence in Burundi Since Independence
Chart Nine: Effects of Ethnic Violence in Burundi, Deaths and Refugees
Chart Ten: Population Growth Trends in Burundi
Chart Eleven: Crude Birth and Death Rates for Burundi
Chart Twelve: Comparing Total Fertility Rates for Burundi and Rwanda with World Rates
Chart Thirteen: Food Production Index for Burundi
Chart Fourteen: Burundi's Use of Fertilizers from 1961 - 1993
Chart Fifteen: Burundi's Arable and Permanent Cropland 1961 - 1993
Chart Sixteen: Arable and Permanent Cropland Per Person for Burundi
Chart Seventeen: Food Per Capita Production Index in Burundi
Chart Eighteen: Gross National Product in US$ for Burundi and Rwanda
Chart Nineteen: Gross Domestic Product Per Capital for Burundi and Rwanda
Chart Twenty: Gross National Procuct Per Capita in Burundi and Rwanda
Chart Twenty-One: Evolution of Coffee Production in Burundi by Type
Chart Twenty-Two: Cattle Stocks in Burundi , 1961 - 1994
Chart Twenty-Three: Total Freshwater Catch for Burundi, 1970 to 1993
Chart Twenty-Four: Popuation Growth Plotted Against Ethnic Violence in Burundi
Chart Twenty-Five: Arable and Permanent Cropland Per Person In Burundi Plotted Against Deaths